Stock Average Calculator
Initial Investment
Calculate Future Profit
What is Stock Average Calculator?
The Stock Average Calculator is a tool that calculates the average price of stocks in your portfolio. It considers factors like the number of shares, purchase prices, and dates to provide you with an accurate average cost per share. This helps you track your investment performance and make informed decisions. With the Stock Average Calculator, you can easily assess profitability, understand gains or losses, and optimize your investment strategies. It’s a valuable tool for both novice and experienced investors in managing their portfolios effectively.
How Stock Average Calculator works?
The Stock Average Calculator works by taking the inputs you provide, such as the number of shares, purchase prices, and dates, and using them to calculate the average price per share for your stock holdings.
Here’s a step-by-step breakdown of how Stock Average Calculator works:
1. Input your stock purchase details: Enter the number of shares you bought, the purchase price per share, and the corresponding dates of each purchase into the calculator.
2. Calculation of individual costs: The Stock Average Calculator multiplies the number of shares by the purchase price for each transaction, determining the individual cost of each batch of shares.
3. Total cost calculation: The Stock Average Calculator sums up the individual costs of all the transactions to find the total cost of your stock holdings.
4. Total shares calculation: The Stock Average Calculator adds up the number of shares from all the transactions to determine the total number of shares in your portfolio.
5. Average price per share calculation: By dividing the total cost by the total number of shares, the Stock Average Calculator provides you with the average price per share.
6. Display of results: The calculated average price per share is displayed, giving you a clear understanding of the average cost of your stock holdings.
The Stock Average Calculator streamlines this process, performing the necessary calculations quickly and accurately. It eliminates the need for manual calculations, saving you time and ensuring precise results.
| Transaction | Number of Shares | Purchase Price per Share | Date | Individual Cost |
|---|---|---|---|---|
| Transaction 1 | 100 | $50 | 2022-01-01 | $5,000 |
| Transaction 2 | 150 | $45 | 2022-03-15 | $6,750 |
| Transaction 3 | 50 | $55 | 2022-06-30 | $2,750 |
| Transaction 4 | 200 | $40 | 2022-09-10 | $8,000 |
In this example, we have four transactions with different numbers of shares, purchase prices per share, and dates. Now, let’s calculate the average price per share using the Stock Average Calculator:
Calculation of individual costs:
- Transaction 1: 100 shares * $50 = $5,000
- Transaction 2: 150 shares * $45 = $6,750
- Transaction 3: 50 shares * $55 = $2,750
- Transaction 4: 200 shares * $40 = $8,000
Total cost calculation:
$5,000 + $6,750 + $2,750 + $8,000 = $22,500
Total shares calculation:
100 shares + 150 shares + 50 shares + 200 shares = 500 shares
Average price per share calculation:
$22,500 / 500 shares = $45
Therefore, based on the inputs provided, the Stock Average Calculator determines that the average price per share for your stock holdings is $45.
Using this calculated average, you can evaluate your investment performance, track gains or losses, and make informed decisions about your portfolio.
What is averaging in Stock Market?
Averaging, in the context of the stock market, typically refers to a strategy called “dollar-cost averaging” or “stock averaging.” It is an investment technique where an investor systematically buys a fixed dollar amount or a fixed number of shares of a particular stock or investment at regular intervals, regardless of the stock’s price.
Here’s how dollar-cost averaging works with an example:
Let’s say you decide to invest $1,000 in a specific stock using the dollar-cost averaging strategy. Instead of investing the entire $1,000 at once, you divide it into smaller investments over time. For simplicity, let’s assume you invest $100 each month for ten months.
Month 1: The stock price is $50 per share. With your $100 investment, you buy 2 shares.
Month 2: The stock price increases to $60 per share. Again, your $100 investment buys 1.67 shares.
Month 3: The stock price drops to $45 per share. Your $100 investment purchases 2.22 shares.
Month 4: The stock price rises to $55 per share. You buy 1.82 shares with your $100 investment.
…
Month 10: The stock price fluctuates and settles at $50 per share. Your $100 investment buys 2 shares.
By the end of the ten-month period, you would have accumulated a total of 17.36 shares of the stock.
The purpose of averaging in the stock market is to mitigate the impact of market volatility and minimize the risk of making large investments at unfavorable times. By investing regularly and consistently, regardless of short-term market fluctuations, you end up buying more shares when prices are low and fewer shares when prices are high.
In this example, your average purchase price per share would be the total investment ($1,000) divided by the total number of shares acquired (17.36), resulting in an average price per share of approximately $57.63. By using the averaging strategy, you’ve effectively spread out your investment and obtained a more balanced average price, benefiting from the fluctuating market over time.
Dollar cost averaging can be particularly useful for long-term investors who are looking to build wealth steadily over time, as it reduces the reliance on trying to time the market and takes advantage of market fluctuations to accumulate shares at different prices.
| Month | Stock Price | Investment Amount | Number of Shares Purchased | Average Purchase Price per Share |
|---|---|---|---|---|
| 1 | $50 | $100 | 2 | $50.00 |
| 2 | $60 | $100 | 1.67 | $59.88 |
| 3 | $45 | $100 | 2.22 | $45.05 |
| 4 | $55 | $100 | 1.82 | $54.95 |
| 5 | $50 | $100 | 2 | $51.82 |
| 6 | $52 | $100 | 1.92 | $51.93 |
| 7 | $48 | $100 | 2.08 | $48.68 |
| 8 | $55 | $100 | 1.82 | $53.85 |
| 9 | $58 | $100 | 1.72 | $58.14 |
| 10 | $50 | $100 | 2 | $54.63 |
By the end of the ten-month period, the total investment would be $1,000, and the total number of shares acquired would be 17.36. The average purchase price per share would be approximately $57.63.
Why is a Stock Average Calculator needed?
An Stock Average Calculator is needed for several reasons:
1. Portfolio Evaluation:
Investors often have multiple transactions and purchases of the same stock at different prices. The Stock Average Calculator helps determine the average price per share, allowing investors to evaluate the overall performance of their stock holdings accurately.
2. Investment Decision Making:
The Stock Average Calculator provides crucial data for making informed investment decisions. By knowing the average price per share, investors can assess whether the current market price offers potential gains or if it’s time to consider selling their holdings.
3. Profitability Analysis:
Calculating the average price per share helps investors assess the profitability of their stock investments. By comparing the average price to the current market price, investors can determine the profit or loss on their holdings and make appropriate adjustments to their investment strategies.
4. Portfolio Diversification:
Investors aiming to diversify their portfolio can use the Stock Average Calculator to determine the average price per share of their existing holdings. This information helps them allocate new investments more effectively to achieve a balanced and diversified portfolio.
5. Risk Management:
By knowing the average price per share, investors can better manage risk. They can assess the potential impact of price fluctuations on their overall investment, identify potential losses, and set risk mitigation strategies accordingly.
6. Tax Purposes:
The Stock Average Calculator can assist in tax reporting and capital gains calculations. Investors can determine the cost basis for their holdings, which is crucial for accurately reporting taxable gains or losses when selling stocks.
Overall, the Stock Average Calculator is an essential tool for investors to analyze their portfolio, make informed decisions, evaluate profitability, manage risk, and ensure accurate tax reporting. It simplifies complex calculations, providing investors with the necessary data to optimize their investment strategies and achieve their financial goals.
Benefits of Stock Average Calculator:
The Stock Average Calculator offers several benefits to investors. Here are some key advantages with examples:
1. Accurate Portfolio Evaluation:
The Stock Average Calculator provides an accurate assessment of your investment portfolio by calculating the average price per share. This helps you understand the true performance of your holdings. For example, if you have purchased 100 shares of a stock at $50 per share and later purchased 200 shares at $60 per share, the Stock Average Calculator would reveal that your average price per share is $56.67. This information allows you to evaluate your portfolio’s performance accurately.
2. Informed Investment Decisions:
The Stock Average Calculator equips you with valuable information for making informed investment decisions. Suppose the current market price of a stock you own is $70 per share, but your average price per share is $50. This indicates a potential gain of $20 per share. By using the Stock Average Calculator, you can evaluate whether it’s the right time to sell, hold, or buy more shares based on the price differential.
3. Profitability Assessment:
The Stock Average Calculator helps you assess the profitability of your investments. For instance, if you purchased 500 shares of a stock at various prices and your average price per share is $45, you can compare it to the current market price to determine your potential gains or losses. If the market price is $60, you have a potential profit of $7,500 ($15 per share). This information allows you to gauge the profitability of your holdings accurately.
4. Risk Management:
The Stock Average Calculator aids in risk management by providing insights into your investment’s risk-reward profile. Suppose you own 1,000 shares of a stock with an average price per share of $80, but the current market price is $90. By knowing your average price, you can assess the potential downside risk if the market price drops. This knowledge helps you make informed decisions regarding risk mitigation, such as setting stop-loss orders or adjusting your portfolio allocation.
5. Tax Planning and Reporting:
The Stock Average Calculator assists in tax planning and reporting by determining the cost basis of your investments. When selling stocks, you need to calculate the capital gains or losses based on the purchase price. By using the calculator, you can accurately determine the average price per share, which is essential for tax reporting and ensuring compliance with tax regulations.
In summary, the Stock Average Calculator provides accurate portfolio evaluation, enables informed investment decisions, assesses profitability, aids in risk management, and facilitates tax planning and reporting. These benefits empower investors to make smarter investment choices and optimize their overall investment strategy.
How to use an average down calculator?
Using an average down calculator is relatively straightforward. Follow these steps to utilize an average down calculator effectively:
Input Initial Investment: Enter the initial investment amount or the purchase price of the stock. This represents the first purchase you made.
Enter Current Holding: Specify the total number of shares you currently hold.
Enter Average Price: Input the average price per share of your current holding. If you don’t have this information, you can leave it blank or enter the initial purchase price as an approximation.
Enter Additional Investment: Enter the additional amount you wish to invest in the stock or the number of shares you plan to purchase with the average down strategy.
Calculate Average Down: Click on the “Calculate” button or similar functionality to obtain the average down price.
| Step | Description |
|---|---|
| 1. Input Initial Investment | Enter the initial investment amount or the purchase price of the stock. |
| Example: Initial Investment: $1,000 | |
| 2. Enter Current Holding | Specify the total number of shares you currently hold. |
| Example: Current Holding: 50 shares | |
| 3. Enter Average Price | Input the average price per share of your current holding. |
| Example: Average Price: $20 per share | |
| 4. Enter Additional Investment | Enter the additional amount you wish to invest in the stock or the number of shares you plan to purchase with the average down strategy. |
| Example: Additional Investment: $500 | |
| 5. Calculate Average Down | Click on the “Calculate” button or similar functionality to obtain the average down price. |
Following these steps and inputting the example values into the average down calculator, you would calculate the average down price per share. In this case, assuming the calculator determines the average down price to be $15 per share, you would invest an additional $500 at this price.
By investing the additional $500 at the average down price of $15 per share, you would be able to acquire approximately 33.33 shares ($500 / $15 = 33.33 shares). The average price per share of your combined holding would then be adjusted based on the additional investment.
Applying the Stock Average Calculator into Your Portfolio:
Integrating the Stock Average Calculator into your investment workflow can provide valuable insights and help you make informed decisions. Here are some key steps to effectively incorporate the Stock Average Calculator into your investment process:
Understand the Calculator’s Functionality:
Familiarize yourself with the features and capabilities of the Stock Average Calculator you plan to use. Ensure it meets your specific needs and provides accurate calculations for average stock prices.
Organize Transaction Data:
Maintain a record of all your stock transactions, including the number of shares purchased, purchase prices, and dates. Keep this information up to date and easily accessible for input into the calculator.
Input Transaction Data:
Enter the transaction details into the Stock Average Calculator. Include the number of shares and purchase prices for each transaction to accurately calculate the average price.
Track Portfolio Performance:
Regularly update the Stock Average Calculator with new transactions to track the performance of your portfolio over time. This will help you monitor changes in the average stock price and evaluate the impact of new investments.
Analyze Average Price Movements:
Utilize the Stock Average Calculator to analyze the movement of the average stock price. Compare it to the current market price to determine if your average cost is above or below the market value.
Adjust Investment Strategies:
Based on the analysis of the average stock price, consider adjusting your investment strategies. For instance, if the average cost is higher than the market price, you may decide to hold or sell the stock. Conversely, if the average cost is lower, you may consider accumulating more shares.
Evaluate Potential Gains or Losses:
Utilize the Stock Average Calculator to assess potential gains or losses when selling stocks. By comparing the current market price with your average cost, you can estimate your profit or loss before making any selling decisions.
Monitor Market Trends:
Stay informed about market trends and stock performance. Regularly update the Stock Average Calculator with new market prices to have accurate data for analysis.
Review and Adjust Regularly:
Periodically review your investment performance using the Stock Average Calculator. Adjust your investment strategies as needed based on changes in the average stock price and market conditions.
How to Design a Portfolio Using Stock Average Calculator:
Here’s an example table showcasing a portfolio using a Stock Average Calculator:
| Stock | Number of Shares | Purchase Price per Share | Total Investment | Average Price per Share | Current Market Price | Market Value | Gain/Loss |
|---|---|---|---|---|---|---|---|
| Company A | 100 | $50 | $5,000 | $50 | $55 | $5,500 | $500 |
| Company B | 150 | $45 | $6,750 | $45 | $40 | $6,000 | -$750 |
| Company C | 200 | $40 | $8,000 | $40 | $50 | $10,000 | $2,000 |
| Total | 450 | $19,750 | $43.89 | $21,500 | $1,750 |
In this example, the portfolio consists of three stocks: Company A, Company B, and Company C. Each stock’s transaction details are recorded, including the number of shares purchased and the corresponding purchase prices.
The Total Investment column represents the total amount invested in each stock, calculated by multiplying the number of shares by the purchase price. The Average Price per Share column shows the average price per share for each stock, calculated using a Stock Average Calculator.
The last row displays the overall totals for the portfolio, including the total number of shares and the total investment amount. The average price per share for the entire portfolio is calculated by dividing the total investment by the total number of shares, resulting in an average of $43.89 per share.
The current market price represents the most recent price at which the stock is trading in the market. In the given example, for Company A, the current market price is $55 per share, for Company B, it is $40 per share, and for Company C, it is $50 per share.
The market value column shows the current value of each stock in your portfolio. It is calculated by multiplying the current market price by the number of shares held. In the given example, for Company A, the market value is $5,500 ($55 current market price * 100 shares), for Company B, it is $6,000 ($40 current market price * 150 shares), and for Company C, it is $10,000 ($50 current market price * 200 shares).
The gain or loss column indicates the profit or loss made on each stock. It is calculated by subtracting the total investment from the market value. In the given example, for Company A, the gain is $500 ($5,500 market value – $5,000 total investment), for Company B, the loss is -$750 ($6,000 market value – $6,750 total investment), and for Company C, the gain is $2,000 ($10,000 market value – $8,000 total investment).
How to calculate the average price of the stock?
Here is a step-by-step process of calculating the average price of a stock using a Stock Average Calculator, along with an example:
Step 1: Gather Transaction Data Collect the transaction data for the stock, including the number of shares purchased and the corresponding purchase prices. Ensure you have the complete and accurate information for each transaction.
Example: Let’s consider an example of buying shares of Company XYZ:
- Transaction 1: Purchased 100 shares of Company XYZ at $50 per share.
- Transaction 2: Purchased an additional 50 shares of Company XYZ at $55 per share.
- Transaction 3: Bought 75 more shares of Company XYZ at $60 per share.
Step 2: Calculate Total Investment For each transaction, multiply the number of shares purchased by the purchase price to calculate the total investment for that particular transaction.
Example:
- Transaction 1: 100 shares * $50 per share = $5,000
- Transaction 2: 50 shares * $55 per share = $2,750
- Transaction 3: 75 shares * $60 per share = $4,500
Step 3: Sum Total Investments Add up the total investment amounts from all the transactions to determine the overall total investment.
Example: Total Investment = $5,000 + $2,750 + $4,500 = $12,250
Step 4: Sum Total Shares Add up the number of shares purchased in all the transactions to determine the total number of shares held.
Example: Total Shares = 100 + 50 + 75 = 225 shares
Step 5: Calculate Average Price per Share Divide the total investment by the total number of shares to calculate the average price per share.
Example: Average Price per Share = Total Investment / Total Shares Average Price per Share = $12,250 / 225 shares ≈ $54.44 per share
| Transaction | Number of Shares | Purchase Price per Share | Total Investment |
|---|---|---|---|
| 1 | 100 | $50 | $5,000 |
| 2 | 50 | $55 | $2,750 |
| 3 | 75 | $60 | $4,500 |
| Total | 225 | $12,250 | |
| Average | $54.44 |
Frequently Asked Questions:
Q1: Why is a stock average calculator useful for investors?
A stock average calculator is useful for investors as it allows them to determine the average price per share of a stock in their portfolio. This information helps investors track their investment performance, assess the cost basis of their holdings, and make informed decisions based on the average price per share.
Q2: Can I use a stock average calculator for multiple stocks in my portfolio?
Yes, you can use a stock average calculator for multiple stocks in your portfolio. The calculator allows you to input the transaction data for each stock separately and calculate the average price per share for each stock individually. This helps you track the average cost basis and performance of each stock in your portfolio.
Q3:How accurate is the average price calculated by a stock average calculator?
The accuracy of the average price calculated by a stock average calculator depends on the accuracy of the input data provided by the user. If the transaction details, including the number of shares purchased and their corresponding purchase prices, are entered correctly, the calculated average price should be accurate. However, it’s essential to ensure that all relevant factors, such as fees, commissions, and any adjustments, are taken into account for a more precise calculation.
Q4: Is a stock average calculator suitable for all types of investors, including beginners?
Yes, a stock average calculator is suitable for all types of investors, including beginners. It is a user-friendly tool that helps in calculating the average price per share of stocks in a portfolio. Beginners can use it to track their investments, understand their cost basis, and make informed decisions. The calculator simplifies the process and eliminates the need for manual calculations, making it accessible and beneficial for investors at any experience level.
Q5: How do you calculate the stock average down?
To calculate stock average down, determine your total investment in the stock, including the number of shares you own. Add any additional shares you plan to purchase at a lower price. Divide the new total investment by the updated number of shares to calculate the average price per share after averaging down.
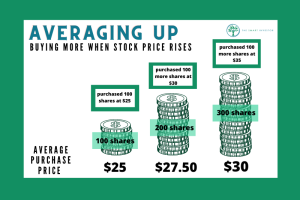
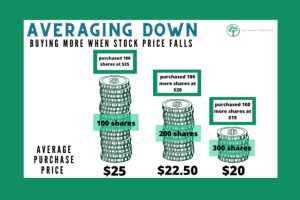
Q6: Should I average up or average down stocks?
Stock averaging, whether up or down, depends on your investment strategy and risk tolerance. Averaging up involves buying more shares as the price rises, indicating confidence in future growth. Averaging down means buying more shares as the price falls, aiming to lower the average cost. The choice depends on your outlook and belief in the stock’s potential. Assess the fundamentals, market conditions, and risks before deciding which approach aligns with your goals.