Introduction:
In the world of investing, making informed decisions is key to achieving financial goals and maximizing returns. One powerful tool that aids in decision-making is the dollar cost averaging (DCA) calculator. However, to further enhance its effectiveness, visualization plays a crucial role. Visualizing the outputs of a dollar cost averaging calculator can provide investors with valuable insights and a clearer understanding of their investment strategy. In this article, we explore the significance of visualization in the context of a dollar cost averaging calculator and how it can empower investors to make informed decisions.
Understanding Dollar Cost Averaging and its Benefits:
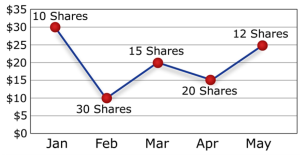
Dollar cost averaging is an investment strategy that involves regularly investing a fixed amount at predetermined intervals, regardless of market conditions. This strategy aims to reduce the impact of market volatility by buying more shares when prices are low and fewer shares when prices are high. The benefits of dollar cost averaging include mitigating risk, instilling discipline, and potentially maximizing long-term returns.
The Power of Visualization in Investing:
Visualization is a powerful cognitive tool that helps individuals process complex information and make sense of data. When applied to investing, visualization can enhance decision-making by providing a clear visual representation of investment patterns, trends, and potential outcomes. It enables investors to grasp complex concepts quickly, identify patterns, and gain insights that might otherwise be missed. Visualizing the outputs of a dollar cost averaging calculator takes the strategy beyond numbers and transforms it into a tangible and intuitive representation.
How Visualization Enhances Dollar Cost Averaging Strategy:
By visualizing the outputs of a dollar cost averaging calculator, investors can gain a deeper understanding of their investment strategy. Graphs, charts, and interactive visualizations allow investors to see the progression of their investments over time, observe the impact of market fluctuations, and evaluate the effectiveness of their DCA approach. Visualization enables investors to identify trends, spot opportunities, and make adjustments to their strategy with confidence.
Benefits of Visualizing Dollar Cost Averaging Outputs:
Enhanced Understanding:
Visualizations provide a clear representation of investment performance, making it easier to comprehend and evaluate the effectiveness of the DCA strategy. Investors can visually track their investments’ growth, observe the average cost per share, and identify the impact of market fluctuations on their portfolio.
Emotional Impact:
Visualizations evoke emotions and make the investment journey more engaging. Seeing the progress of investments visually can instill confidence, motivate investors during market downturns, and reinforce their long-term investment goals. Visualization can create a sense of accomplishment and encourage investors to stay committed to their strategy.
Spotting Opportunities:
Visualization allows investors to identify patterns and potential opportunities. By visualizing market trends and the performance of different assets, investors can make more informed decisions on adjusting investment amounts, rebalancing portfolios, or seizing favorable market conditions.
Decision-Making Clarity:
Visualizing the outputs of a dollar cost averaging calculator simplifies complex data and aids in decision-making. It provides a comprehensive view of investment progress and allows investors to compare different scenarios, assess potential outcomes, and make data-driven decisions.
Utilizing Interactive Tools for Visualization:
To fully leverage the power of visualization in dollar cost averaging, interactive tools and platforms can be employed. These tools allow investors to customize visualizations based on their preferences and provide a more interactive and immersive experience. Investors can explore different timeframes, adjust investment amounts, and simulate various market scenarios to gain a deeper understanding of their investments.
Frequently Asked Questions:
Q1: Can visualization guarantee investment success?
No, visualization alone cannot guarantee investment success. Visualization is a tool that enhances decision-making and provides insights into investment patterns and trends. While it can help investors make more informed decisions, investment success depends on various factors, including market conditions, diversification, risk management, and the investor’s knowledge and experience. It’s important to conduct thorough research, seek professional advice, and maintain a disciplined investment approach alongside visualization.
Q2: What types of visualizations are commonly used in dollar cost averaging?
Common types of visualizations used in dollar cost averaging include line charts, bar charts, candlestick charts, and interactive graphs. Line charts are effective in illustrating the performance of investments over time, while bar charts provide a visual representation of the investment amounts at different intervals. Candlestick charts are often used to depict the highs, lows, opening, and closing prices of assets. Interactive graphs allow investors to customize visualizations based on their preferences and explore different scenarios.
Q3: Are there any specific tools or software for visualizing dollar cost averaging calculations?
Yes, there are various tools and software available for visualizing dollar cost averaging calculations. Many online brokerage platforms and investment apps provide built-in visualization features that allow investors to track their investments, view performance charts, and analyze the impact of their dollar cost averaging strategy. Additionally, there are standalone financial software programs and online tools that specifically cater to visualizing investment data. It’s important to choose a tool or software that suits your needs and provides the desired level of visualization capabilities.
Q4: How frequently should I review and update my visualized dollar cost averaging strategy?
The frequency of reviewing and updating your visualized dollar cost averaging strategy depends on several factors, including your investment goals, market conditions, and personal preferences. It’s generally recommended to review your strategy periodically, such as quarterly or annually, to assess its performance and make necessary adjustments. However, it’s crucial to avoid making frequent changes based on short-term market fluctuations, as dollar cost averaging is a long-term investment strategy. Regular monitoring and review can help ensure your strategy aligns with your financial goals and market trends.
Conclusion:
Visualizing the outputs of a dollar cost averaging calculator brings numerous benefits to investors. It enhances understanding, evokes emotions, helps identify opportunities, and provides decision-making clarity. By leveraging visualization techniques, investors can gain a holistic view of their investments, make informed decisions, and stay committed to their long-term financial goals.